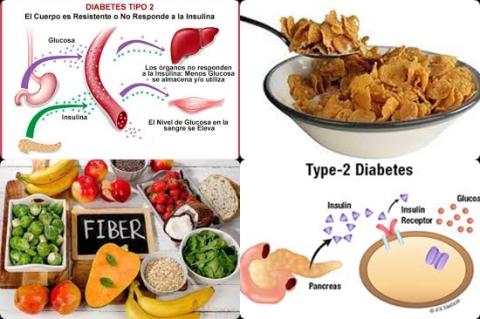
Nutritional advice

88 µg/d vitamin D supplementation reduces type 2 diabetes

Objectives:
Diabetes prevention is a public health priority. Vitamin D supplementation may help prevent the development of diabetes in persons at increased risk. Therefore, this review article has been conducted.

Does vitamin D supplementation reduce risk of type 2 diabetes?

Study design:
This review article included 28 RCTs with 3,848 participants.

The sample size varied from 23 to 511.
The mean age of participants ranged from 26 years to 71 years.
The duration of follow-up across studies ranged from 2 months to 5 years, with a median follow-up of 22 weeks [interquartile range (IQR): 14 to 48 weeks], a duration long enough to detect changes in measured outcomes.

The average vitamin D supplementation dose of 88 µg/d (3500 IU/d).
All included trials measured the effect of vitamin D supplementation on serum 25(OH)D concentrations.

Results and conclusions:
The investigators found overall, serum 25(OH)D concentrations in the treated arms (vitamin D-supplemented groups) significantly improved by 45.1 nmol/L [95% CI = 41.3 to 48.9, p 0.001, I2 = 97.4%].

The investigators found compared with the control group, vitamin D supplementation significantly reduced HbA1c level by -0.48% [95% CI = -0.79 to -0.18, p = 0.002, I2 = 92.1%].
However, after adjusting the effect size for potential publication bias using the “trim and fill” method, 4 potentially missing studies were imputed in the funnel plot and the effect size increased from -0.48% [95% CI = -0.79 to -0.18] to -0.71% [95% CI = -1.02 to -0.39].

The investigators found compared with the control group, vitamin D supplementation significantly reduced fasting plasma glucose level by -0.46 mmol/L [95% CI = -0.74 to -0.19, p = 0.001, I2 = 92.4%].  
However, after adjusting the effect size for potential publication bias using the “trim and fill” method, 6 potentially missing studies were imputed in the funnel plot and the effect size increased -0.46 mmol/L [95% CI = -0.74 to ­0.19] to -0.72 mmol/L [95% CI =-1.02 to -0.42].

The investigators found compared with the control group, vitamin D supplementation significantly reduced HOMA-IR level by -0.39 [95% CI = -0.68 to -0.11, p = 0.007, I2 = 91.3%].
However, after adjusting the effect size for potential publication bias using the “trim and fill” method, 5 potentially missing studies were imputed in the funnel plot and the effect size increased from -0.39 [95% CI = -0.68 to -0.11] to -0.62 [95% CI = -0.92 to -0.32].

The investigators found in subgroup analysis both HbA1c and HOMA-IR showed a greater reduction over time among overweight/obese individuals compared with prediabetics [HbA1c = -0.98 ± 0.45 vs -0.29 ± 0.14, p = 0.1 and HOMA-IR = -0.62 ± 0.23 vs -0.07 ± 0.16, p = 0.05].

The investigators found in subgroup analysis vitamin D supplementation significantly decreased HbA1c [p = 0.05], fasting plasma glucose level [p = 0.05] and HOMA-IR [p = 0.1] to a greater extent when serum 25(OH)D concentration achieved was above 86 nmol/L.

The investigators found in subgroup analysis vitamin D supplementation for less than 6 months provided a larger effect size on HbA1c in comparison with long durations [-0.75 ± 0.33 vs -0.25 ± 0.11, p = 0.1].

The investigators found in subgroup analysis HbA1c showed greater improvement in populations with a mean age younger than 45 years in comparison with older populations [-1.15 ± 0.6 vs -0.30 ± 0.1, p = 0.05].

The investigators found in subgroup analysis greater reductions were found within HbA1c and fasting plasma glucose levels when baseline (at the beginning of the study) mean serum 25(OH)D concentration was ≥50 nmol/L, whereas the lowering effect was significantly less in the subgroup with baseline mean 25(OH)D 50 nmol/L [HbA1c = -0.79 ± 0.25 vs -0.14 ± 0.13, p = 0.04 and fasting plasma glucose level = -0.69 ± 0.21 vs -0.11 ± 0.10, p = 0.05].

The investigators concluded 88 µg/d vitamin D supplementation during 22 weeks improves glycemic measures and insulin sensitivity and may be useful as part of a preventive strategy for type 2 diabetes, particularly among overweight/obese individuals younger than 45 years.

Original title:
Vitamin D Supplementation, Glycemic Control, and Insulin Resistance in Prediabetics: A Meta-Analysis by Mirhosseini N, Vatanparast H, [...], Kimball SM.

Link:
https://www.ncbi.nlm.nih.gov/pmc/articles/PMC6016617/

Additional information of El Mondo:
Find more information/studies on diabetes and vitamin D right here.

HbA1c, FPG, HOMA-IR and plasma glucose after 2-hour oral glucose tolerance test (2HPG) are different parameters associated with (pre)diabetes.
 

1 serving/day potato increases risk type 2 diabetes

Afbeelding

Objectives:
High potato intake has been suggested as a risk factor for the development of type 2 diabetes. Therefore, this review article has been conducted.

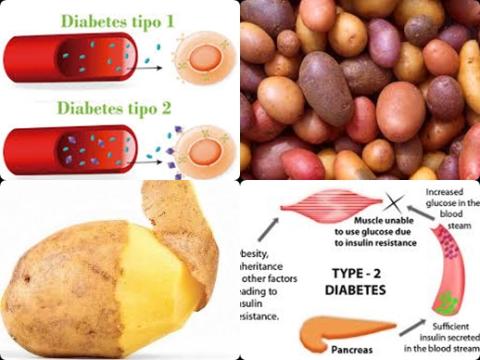
Does potato intake increase risk of type 2 diabetes?

Study design:
This review article included 6 prospective cohort studies with a total of 4,545,230 person-year of follow-up and 17,758 diabetes cases.

Results and conclusions:
The investigators found for every increment of 1 serving/day of total potato consumption a significantly increased risk of 20% [HR = 1.20, 95% CI = 1.13 to 1.127, p 0.001, I2 = 27.1%, p for heterogeneity = 0.23] for type 2 diabetes both in men en women.

The investigators found for 2 servings/day of total potato consumption a significantly increased risk of 44% [HR = 1.44, 95% CI = 1.28 to 1.63] for type 2 diabetes both in men en women.

The investigators found for 3 servings/day of total potato consumption a significantly increased risk of 74% [HR = 1.74, 95% CI = 1.45 to 2.09] for type 2 diabetes both in men en women.

The investigators found significant evidence of a non-linear association between total potato consumption and risk of type 2 diabetes [X2 = 17.5, p for linearity 0.001].

The investigators concluded that long-term high consumption of potato (each serving a day increase) is strongly associated with increased risk of type 2 diabetes. These findings suggest that diet-health policy may be of importance in the prevention of diabetes.

Original title:
Potato consumption and risk of type 2 diabetes: A dose-response meta-analysis of cohort studies by Bidel Z, Teymoori F, […], Nazarzadeh M.

Link:
https://www.ncbi.nlm.nih.gov/pubmed/30144898

Additional information of El Mondo:
Find more information/studies on diabetes right here.

According to the USDA Dietary Guidelines a serving of potato is 1 cup diced, mashed or baked or 1 medium boiled potato.


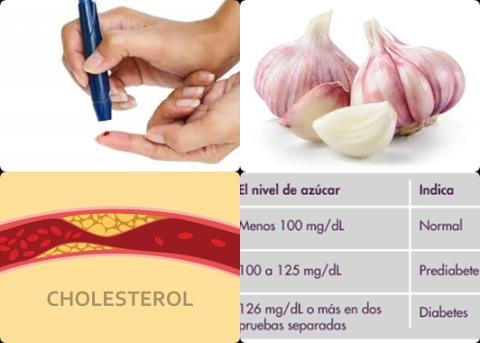
Garlic increases good cholesterol in diabetic patients

Afbeelding

Objectives:
Several studies have been published about the effect of garlic on lipid profile and blood glucose in diabetic patients. Which, the results mostly contradict with each other. Therefore, this review article has been conducted.

Does garlic improve lipid profile and blood glucose in diabetic patients?

Study design:
This review article included 33 articles with a total of 1,273 individuals, with a mean of 39 samples per study.

Results and conclusions:
The investigators found the concentration of serum total cholesterol significantly decreased wih 16.87 mg/dL [95% CI = -21.01 to -12.73, p = 0.001] in the garlic group when compared with the placebo group.

The investigators found the concentration of serum LDL cholesterol (bad cholesterol) significantly decreased with 9.65 mg/dL [95% CI = -15.07 to -4.23, p = 0.001] in the garlic group when compared with the placebo group.

The investigators found the concentration of serum triglycerides significantly decreased with 12.44 mg/dL [95% CI = -18.19 to -6.69, p = 0.001] in the garlic group when compared with the placebo group.

The investigators found the concentration of serum HDL cholesterol (good cholesterol) significantly increased with 3.19 mg/dL [95% CI = 1.85 to 4.53, p = 0.001] in the garlic group when compared with the placebo group.

The investigators found the concentration of serum fasting blood sugar significantly decreased with 10.90 mg/dL [95% CI = -16.40 to -5.40, p = 0.001] in the garlic group when compared with the placebo group.

The investigators found the concentration of serum HbA1c significantly decreased with 0.60 mg/dL [95% CI = -0.98 to -0.22, p = 0.001] in the garlic group when compared with the placebo group.

The investigators concluded that garlic improves lipid profile as well as glucose parameters and can be therapeutically effective in patients suffering from cardiovascular diseases and diabetes.

Original title:
The effect of garlic on lipid profile and glucose parameters in diabetic patients: A systematic review and meta-analysis by Shabani E, Sayemiri K and Mohammadpour M.

Link:
https://www.ncbi.nlm.nih.gov/pubmed/30049636

Additional information of El Mondo:
Find more information/studies on diabetes, cholesterol, meta-analyses/heterogeneity and garlic right here.


High intake of cereal fiber may reduce type 2 diabetes

Afbeelding

Objectives:
The purpose of this review article is to review previously published meta-analyses on the effectiveness of dietary fiber on type 2 diabetes.

Study design:
This umbrella review article included 16 meta-analyses.

Results and conclusions:
The investigators found in the meta-analyses when comparing highest versus lowest dietary fiber intake, a statistically significant reduced risk of 15 to 19% [RR = 0.81-0.85] for type 2 diabetes. However, statistically significant heterogeneity was observed in all of these meta-analyses.

The investigators found in the meta-analyses when comparing highest versus lowest dietary cereal fibers, a statistically significant reduced risk of 13 to 33% [RR = 0.67-0.87] for type 2 diabetes. However, statistically significant heterogeneity was observed in all of these meta-analyses.

The investigators found in the meta-analyses of supplementation studies using β-glucan or psyllium fibers on type 2 diabetic participants, statistically significant reductions were identified in both fasting blood glucose concentrations and glycosylated hemoglobin percentages.

The investigators concluded that those consuming the highest amounts of dietary fiber, especially cereal fiber, may benefit from a reduction in the incidence of developing type 2 diabetes. May benefit because statistically significant heterogeneity was observed in all of these meta-analyses.
There also appears to be a small reduction in fasting blood glucose concentration, as well as a small reduction in glycosylated hemoglobin percentage for individuals with type 2 diabetes who add β-glucan or psyllium to their daily dietary intake.

Original title:
Dietary Fiber Intake and Type 2 Diabetes Mellitus: An Umbrella Review of Meta-analyses by McRae MP.

Link:
https://www.ncbi.nlm.nih.gov/pubmed/29628808

Additional information of El Mondo:
Find more information/studies on diabetes, meta-analyses/heterogeneity and dietary fiber right here.


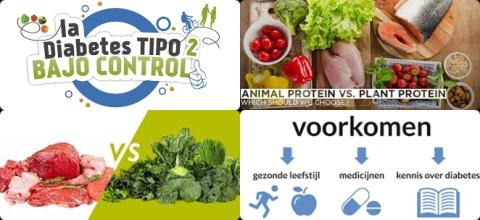
Animal protein increases risk of type 2 diabetes

Afbeelding

Objectives:
The association between dietary protein intake and type 2 diabetes risk has been inconsistent in the previous epidemiological studies. Therefore, this review article (meta-analysis) has been conducted.

Is there an association between dietary protein intake and type 2 diabetes risk?

Study design:
This review article included 10 prospective cohort studies with a total of 34,221 type 2 diabetes cases.
No publication bias was detected.

Results and conclusions:
The investigators found after adjustment of potential confounders, a 5% of energy (5 En%) increment from dietary total protein intake was related to a significantly 9% [95 CI = 1.04-1.13, I2 = 42.0%] higher risk of type 2 diabetes. The results were robust in sensitivity analysis.

The investigators found after adjustment of potential confounders, a 5% of energy (5 En%) increment from dietary animal protein intake was related to a significantly 12% [95 CI = 1.08-1.17, I2 = 14.0%] higher risk of type 2 diabetes. The results were robust in sensitivity analysis.

The investigators found after adjustment of potential confounders, a significant U-shaped curve was observed for plant protein intake with the most risk reduction at about 6% of energy from plant protein intake [p nonlinearity = 0.001]. The results were robust in sensitivity analysis.

The investigators concluded that the consumption of protein, particularly animal protein increases risk of type 2 diabetes.

Original title:
Dietary protein intake and risk of type 2 diabetes: a dose-response meta-analysis of prospective studies by Zhao LG, Zhang QL, [...], Xiang YB.

Link:
https://www.ncbi.nlm.nih.gov/pubmed/29858629

Additional information of El Mondo:
Find more information/studies on diabetes and protein right here.


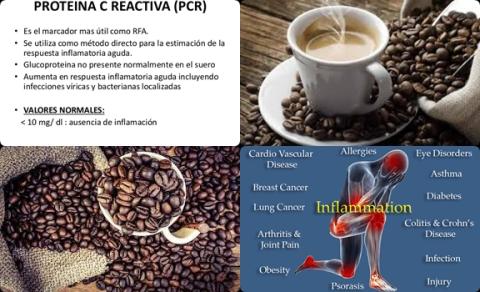
Coffee consumption is associated with a lower level of serum CRP in humans

Afbeelding

Objectives:
The association between coffee consumption and the level of C-reactive protein (CRP) has been evaluated in several epidemiological studies with conflicting results. Therefore, this meta-analysis (systematic review) has been conducted.

Does coffee consumption reduce level of C-reactive protein in humans?

Study design:
This review article included a total of 9 cross-sectional studies.

Results and conclusions:
The investigators found according to the combined standard mean difference (SMD) between the highest and the lowest coffee intake category, coffee consumption was associated with a significantly lower level of serum CRP level [SMD = -0.34, 95% CI = -0.62 to -0.06, p = 0.016].

The investigators found subgroup analysis for CRP marker showed that coffee consumption was associated with a significantly lower level of serum high-sensitivity CRP (hsCRP) [SMD = -0.51, 95% CI = -0.88 to -0.14, p = 0.007], but not standard CRP [SMD = 0.02, 95% CI = -0.28 to 0.32, p = 0.913].

The investigators concluded that coffee consumption is associated with a lower level of serum CRP, particularly serum high-sensitivity CRP. However, more well-designed prospective cohort studies are needed to elaborate the concerned issues further.

Original title:
Is coffee consumption associated with a lower level of serum C-reactive protein? A meta-analysis of observational studies by Zhang Y and Zhang DZ.

Link:
https://www.ncbi.nlm.nih.gov/pubmed/29405789

Additional information of El Mondo:
Find more information/studies on coffee and chronic disease right here.


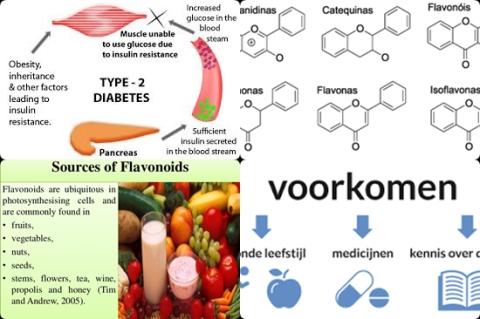
≥550 mg/day flavonoids intake reduce type 2 diabetes

Afbeelding

Objectives:
Epidemiological studies exploring the role of flavonoids intake in preventing type 2 diabetes mellitus (T2DM) showed inconsistent results. Therefore, this review article (meta-analysis) has been conducted.

Does flavonoids intake decrease risk of developing type 2 diabetes?

Study design:
This review article included 10 independent cohorts published between 2002 and 2017 with a total of 312,015 participants, of which 19,953 type 2 diabetes cases were identified during the follow-up periods from 4 to 28 years.
All participants were free of type 2 diabetes at baseline (at the beginning of the study), with age ranging from 28 to 75 years.
Dietary flavonoids intake was evaluated using food-frequency questionnaire and type 2 diabetes was frequently ascertained through medical records.
In the original studies, the median intake level of total flavonoids was 8.9 to 501.8 mg/day for the lowest categories and 33.2 to 1452.3 mg/day for the highest categories.
The most commonly adjusted variables included age, sex, total energy intake, body mass index, smoking, alcohol consumption and physical activity.
All included studies had a NOS score of ≥7, with an average score of 7.9, indicating the presence of high methodological quality.

There was no indication of publication bias from visual inspection of the funnel plot, which was further confirmed by Egger test [p = 0.253].

Results and conclusions:
The investigators found when compared with the lowest intake, the highest intake of total flavonoids was associated with a significantly 9% decreased risk of type 2 diabetes [RR = 0.91, 95% CI = 0.86-0.96, I2  =  21%, p =  0.257].
In stratified analyses, the pooled RR for total flavonoids intake was not modified by sample size, sex, follow-up duration and study location.
Leave-one-out sensitivity analysis showed that no individual study had a significant influence on the final result.

The investigators found in subgroup analyses when compared with the lowest intake, the highest intake of anthocyanidins significantly decreased risk of type 2 diabetes with 11% [RR = 0.89, 95% CI = 0.82-0.95].

The investigators found in subgroup analyses when compared with the lowest intake, the highest intake of flavan-3-ols significantly decreased risk of type 2 diabetes with 14% [RR = 0.86, 95% CI = 0.78-0.95].

The investigators found in subgroup analyses when compared with the lowest intake, the highest intake of flavonols significantly decreased risk of type 2 diabetes with 14% [RR = 0.86, 95% CI = 0.80-0.94].

The investigators found in subgroup analyses when compared with the lowest intake, the highest intake of isoflavones significantly decreased risk of type 2 diabetes with 9% [RR = 0.91, 95% CI = 0.84-0.98].

The investigators found in 9 cohort studies a curvilinear relationship between total flavonoids intake and type 2 diabetes risk [p for nonlinearity = 0.042] with a significant risk reduction at an intake of ≥550 mg/day.

The investigators found when assuming a linear association, the risk of type 2 diabetes was reduced by 5% [RR = 0.95, 95% CI = 0.93-0.97] for each 300-mg/day increment in total flavonoids intake.

The investigators concluded that intakes of total flavonoids, particularly ≥550 mg/day, anthocyanidins, flavan-3-ols, flavonols and isoflavones are associated with significantly decreased risks of type 2 diabetes in the highest versus lowest analyses. Additionally, the dose-response analysis suggest a curvilinear relationship of total flavonoids intake with type 2 diabetes risk; when assuming a linear manner, the risk of type 2 diabetes is reduced by 5% for an increment of 300 mg/day in total flavonoids intake.

Original title:
Flavonoids intake and risk of type 2 diabetes mellitus: A meta-analysis of prospective cohort studies by Xu H, Luo J, [...], Wen Q.

Link:
https://www.ncbi.nlm.nih.gov/pmc/articles/PMC5959406/

Additional information of El Mondo:
Find more information/studies on diabetes and flavonoids right here.

Flavonols

Flavan-3-ols

Flavones

Flavonones

Anthocyanidins

onions

apples

parsley

oranges

blueberries

apples

bananas

bell peppers

grapefruit

bananas

romaine lettuce

blueberries

celery

lemons

strawberries

tomatoes

peaches

apples

tomatoes

cherries

garbanzo beans

pears

oranges


pears

almonds

strawberries

watermelon


cabbage

turnip greens


chili peppers


cranberries

sweet potatoes


cantaloupe


plums

quinoa


lettuce


raspberries


garbanzo beans


Food items

Flavonoid content (mg)

Blueberry (100g)

25-500

Black currant (100g)

130-400

Strawberry (200g)

30-150


High-fat diets increase risk of type 2 diabetes

Afbeelding

Objectives:
There is an increasing trend in the consumption of poor-quality diets worldwide, contributing to the increase of non-communicable diseases. Diet directly influences physiological composition and subsequently physical health. Studies have shown that dietary macronutrient and energy content can influence the proportion of intramuscular fat (IMF), which mediates various metabolic and endocrine dysfunction. Therefore, this review article has been conducted.

Do different types of dietary macronutrient intake increase the proportion of intramuscular fat?

Study design:
This review article included 13 trials (RCTs, quasi-RCTs, controlled trials, randomized controlled crossover trials or controlled crossover trials).

High-fat diets were diets with a proportion of fat between 38 and 85 En%. Participants in high-fat diets were all young to middle aged adults with ages varying between 18 and 50 years.

Participants in starvation diets (a decrease of 25% calorie from weight maintenance energy requirements) and hypocaloric diets (890 calories per day, until 15% weight reduction) followed the diet for 8 days with a 3-week washout period in between.

Cohen’s criteria were used to determine the effect size of SMDs, where a SMD between 0.2 and 0.5 is small, a SMD between 0.5 and 0.8 is moderate and a SMD above 0.8 is large. SMDs below 0.2 were considered unsubstantial.

Results and conclusions:
The investigators found in 6 studies with in a total of 134 participants receiving a high-fat intervention and 135 people receiving a control intervention, that high-fat diets (38 and 85 En% fat) significantly increased the proportion of intramuscular fat [SMD = 1.24, 95% CI = 0.43-2.05, p  = 0.003, I2 = 87%].  
Sensitivity analysis (excluding studies with a quality value 20, smallest sample size 8 and those that do not specify participant characteristics) showed a significantly SMD of 1.26 [95% CI = 0.23-2.28, p = 0.02]. 

The investigators found diets with an increased proportion of carbohydrates decreased the proportion of intramuscular fat.
However, increasing caloric intake with carbohydrates compared to a standardized diet (55 En% carbohydrates, 30 En% fat and 15 En% protein) increased the proportion of intramuscular fat.

The investigators found starvation diets (a decrease of 25% calorie from weight maintenance energy requirements) increased intramuscular fat stores and hypocaloric diets (890 calories per day, until 15% weight reduction) did not result in any intramuscular fat proportion changes.

The investigators concluded that high-fat diets (38 y 85 En%), excessive caloric intake in the form of carbohydrates and short-term starvation diets are associated with increases in the proportion of intramuscular fat. However, further studies are needed to assess the effects of macronutrient combinations on intramuscular fat and the influence of diet-induced intramuscular fat alterations on health outcomes. In addition, intramuscular fat poses a possibly effective clinical marker of health.

Original title:
The Effects of Diet on the Proportion of Intramuscular Fat in Human Muscle: A Systematic Review and Meta-analysis by Ahmed S, Singh D, [...], Kumbhare D.

Link:
https://www.ncbi.nlm.nih.gov/pmc/articles/PMC5826234/

Additional information of El Mondo:
Find more information/studies on fat and carbohydrates consumption and diabetes right here.

Higher intramuscular fat levels are positively associated with insulin resistance and an increased risk of developing type 2 diabetes.

Folic acid supplementation reduces both fasting glucose level, fasting insulin level and HOMA-IR

Afbeelding

Objectives:
Observationally, homocysteine is associated with higher risk of diabetes. Folate, which reduces homocysteine, is promising for the prevention and treatment of diabetes. Previous meta-analysis (review) of 3 trials suggested folate might lower hemoglobin A1c (HbA1c). Therefore, this review article (meta-analysis) has been conducted.

Have folic acid supplementation positive effects on insulin resistance and glycemic control, like HbA1c level and fasting glucose level?

Study design:
This review article included 18 RCTs with in total of 21,081 people with/without diabetes.

Results and conclusions:
The investigators found that folic acid (folate) supplementation significantly reduced fasting glucose level with 0.15 mmol/L [95% CI = -0.29 to -0.01]. Significant means that there is an association with a 95% confidence.

The investigators found that folic acid (folate) supplementation significantly reduced homeostatic model assessment-insulin resistance (HOMA-IR) with 0.83 [95% CI = -1.31 to -0.34].

The investigators found that folic acid (folate) supplementation significantly reduced fasting insulin level with 1.94 μIU/mL [95% CI = -3.28 to -0.61].

The investigators found that folic acid (folate) supplementation had no clear effect on diabetes or HbA1c level.

The investigators concluded that folic acid (folate) supplementation reduces both fasting glucose level, fasting insulin level and homeostatic model assessment-insulin resistance (HOMA-IR) but it has no effect on diabetes or HbA1c level.

Original title:
The effects of folate supplementation on glucose metabolism and risk of type 2 diabetes: a systematic review and meta-analysis of randomized controlled trials by Zhao JV, Schooling CM and Zhao JX.

Link:
https://www.ncbi.nlm.nih.gov/pubmed/29501221

Additional information of El Mondo:
Find more information/studies on diabetes and folic acid right here.

Patients with diabetes often have both an increased fasting glucose level, HOMA-IR value and fasting insulin level.


Low-GI diet is good for patients with type 2 diabetes

Afbeelding

Objectives:
The increasing prevalence of diabetes in the United Kingdom and worldwide calls for new approaches to its management and diets with low glycaemic index have been proposed as a useful means for managing glucose response. However, there are conflicting reports and differences in the results of studies in terms of their effectiveness. Furthermore, the impact of low-glycaemic index diets (low GI-diets) and their long-term use in patients with type 2 diabetes remains unclear. Therefore, this review article (meta-analysis) has been conducted.

Do patients with type 2 diabetes mellitus benefit from low-GI diets?

Study design:
This review article included 6 RCTs.

Results and conclusions:
The investigators found in 2 RCTs that low-glycaemic index (low-GI) diet resulted in a significant improvement in glycated haemoglobin (HbA1c) [0.05]:
low-GI diet Δ = -0.5% [95% CI = -0.61% to -0.39%] vs. high-cereal fibre diet Δ = -0.18% [95% CI = -0.29% to -0.07%] and;
low-GI legume diet Δ = -0.5% [95% = -0.6% to -0.4%] vs. high-wheat fibre diet Δ = -0.3% [95% Cl = -0.4 to -0.2%].

The investigators found in 4 RCTs significant improvements in fasting blood glucose in low-GI diets compared to higher-GI diets or control:
low-GI diet = [150.8 ± 8.7] vs. higher-GI diet = [157.8 ± 10.4 mg/dL, mean ± SD, p = 0.43];
low-GI diet = [127.7] vs. high-cereal fibre diet = [136.8 mg/dL, p = 0.02];
low-GI diet = [6.5 (5.6-8.4)] vs. standard diabetic diet = [6.7 (6.1-7.5 mmol/L), median and interquartile range p > 0.05] and;
low-GI diet = [7.3 ± 0.3] vs. conventional carbohydrate exchange diet = [7.7 ± 0.4 mmol/L, mean ± SEM (Standard Error of Mean), p 0.05].

The investigators concluded that the low-GI diet is more effective in controlling glycated haemoglobin (HbA1c) and fasting blood glucose compared with a higher-GI diet or control in patients with type 2 diabetes. It will useful to evaluate the long-term effectiveness of low-glycaemic index diet in patients with type 2 diabetes.

Original title:
The Effect of Dietary Glycaemic Index on Glycaemia in Patients with Type 2 Diabetes: A Systematic Review and Meta-Analysis of Randomized Controlled Trials by Ojo O, Ojo OO, [...], Wang XH.

Link:
https://www.ncbi.nlm.nih.gov/pmc/articles/PMC5872791/

Additional information of El Mondo:
Find more information/studies on diabetes and GI-diets right here.

A low-GI diet is a diet with a lot of products/meals with a low GI.
Products/meals with a low GI are products/meals with a GI-number of 55 or less.
In daily life, products/meals with a low GI contain at least 1.5 grams fiber per 100 kcal. These products and meals contain at least 1.5 grams fiber per 100 kcal.
 

Vitamin K supplementation has no effect on glycemic control

Afbeelding

Objectives:
Type 2 diabetes mellitus (T2DM) is one of the most important public health issues. Vitamin K supplementation might have favorable effect on risk factors of T2DM. Therefore, this review article (meta-analysis) has been conducted.

Have vitamin K supplementation favorable effects on risk factors of type 2 diabetes mellitus?

Study design:
This review article included 5 RCTs with in total of 533 participants.

There was no evidence of publication bias.

Results and conclusions:
The investigators found overall, meta-analysis did not show any beneficial effect of vitamin K supplementation on both:
-fasting blood sugar levels [-0.91 mg/dL, 95% CI = -2.57 to 0.76, p = 0.28];
-fasting insulin levels [-0.35 μIU/mL, 95% CI = -1.70 to 1.00, p = 0.61];
-HOMA-IR [-0.06, 95% CI = -0.32 to -0.19, p = 0.63] and
-2-h oral glucose tolerance test [-4.00 mg/dL, 95% CI = -20.00 to 11.99, p = 0.62].

The investigators found sensitivity analysis showed that overall estimates were not affected by elimination of any study.

The investigators concluded that vitamin K supplementation has no significant effect on glycemic control in healthy subjects. However, further studies should be performed on diabetic and pre-diabetic patients to determine the effect of vitamin K supplementation on impaired glycemic control.

Original title:
Effect of Vitamin K Supplementation on Glycemic Control: A Systematic Review and Meta-Analysis of Clinical Trials by Shahdadian F, Mohammadi H and Rouhani M.

Link:
https://www.ncbi.nlm.nih.gov/pubmed/29523009

Additional information of El Mondo:
Find more information/studies on diabetes and vitamin K right here.
 

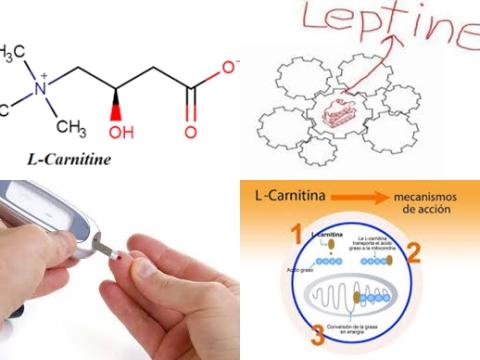
Daily 3 mg L-carnitine during 12 weeks reduce serum leptin concentrations in diabetic patients

Afbeelding

Objectives:
The actual effects of L-carnitine administration on leptin serum level is inconsistent. Therefore, this review article (meta-analysis) has been conducted.

Does L-carnitine supplementation reduce leptin serum level?

Study design:
This review article included 7 RCTs with 325 cases (group with L-carnitine administration) and 330 controls (group without L-carnitine administration).

Subgroup analysis to find the sources of heterogeneity showed that L-carnitine dosage [ 2 g: I2 = 00.0%, p = 0.408] and study population [diabetes: I2 = 46.7%, p = 0.153 and non-diabetes: I2 = 15.1%, p = 0.317] were the potential sources of heterogeneity.

Results and conclusions:
The investigators found that L-carnitine supplementation had no significant effect on serum leptin concentrations [WMD = -0.565 ng/mL, 95% CI = -2.417 to 1.287, p = 0.550, I2 = 84.3%, p  0.0001].

The investigators found in subgroup analysis that  ≥ 2 mg L-carnitine supplementation significantly reduced serum leptin concentrations [WMD = -2.742 ng/mL, 95% CI = -3.039 to -2.444, p  0.001].

The investigators found in subgroup analysis that L-carnitine supplementation significantly reduced serum leptin concentrations in diabetic patients [WMD = -2.946 ng/mL, 95% CI = -3.254 to -2.638, p  0.001].

The investigators found in subgroup analysis that L-carnitine supplementation during 12 weeks significantly reduced serum leptin concentrations [WMD = -2.772 ng/mL, 95% CI = -3.073 to -2.471, p  0.001].

The investigators concluded that at least 3 mg L-carnitine per day in the course of 12 weeks reduce serum leptin concentrations, especially in diabetic patients.

Original title:
The effect of L-carnitine supplementation on serum leptin concentrations: a systematic review and meta-analysis of randomized controlled trials by Nazary-Vannani A, Ghaedi E, […], Varkaneh HK.

Link:
https://www.ncbi.nlm.nih.gov/pubmed/29453657

Additional information of El Mondo:
Find more information/studies on diabetes and L-carnitine and diabetes right here.

L-carnitine is a non-essential amino acid, which is also found in foods.

Food

Carnitine per 100g

Beef steak, cooked, 4 ounces

56-162 mg

Ground beef, cooked, 4 ounces

87-99 mg

Milk, whole, 1 cup

8 mg

Codfish, cooked, 4 ounces

4-7 mg

Chicken breast, cooked, 4 ounces

3-5 mg

Ice cream, ½ cup

3 mg

Cheese, cheddar, 2 ounces

2 mg

Whole-wheat bread, 2 slices

0.2 mg

Asparagus, cooked, ½ cup

0.1 mg